Generating JMeter Report Dashboard
JMeter is probably the most widely used among the slew of load testing tools out there. It has enough features that a tester would need in an ideal performance testing tool. However, it used to lag in a key area of performance testing as compared to other tools. And that is reporting. Well, that’s not the case any more. Because with version 3.0, JMeter sports a brand new reporting feature which eliminates this shortcoming. This feature is called Report Dashboard. In this article, we are going to discuss the same. We will see how we can generate JMeter Report Dashboard after performance test. We will also see what kinds of reports are produced by this feature.
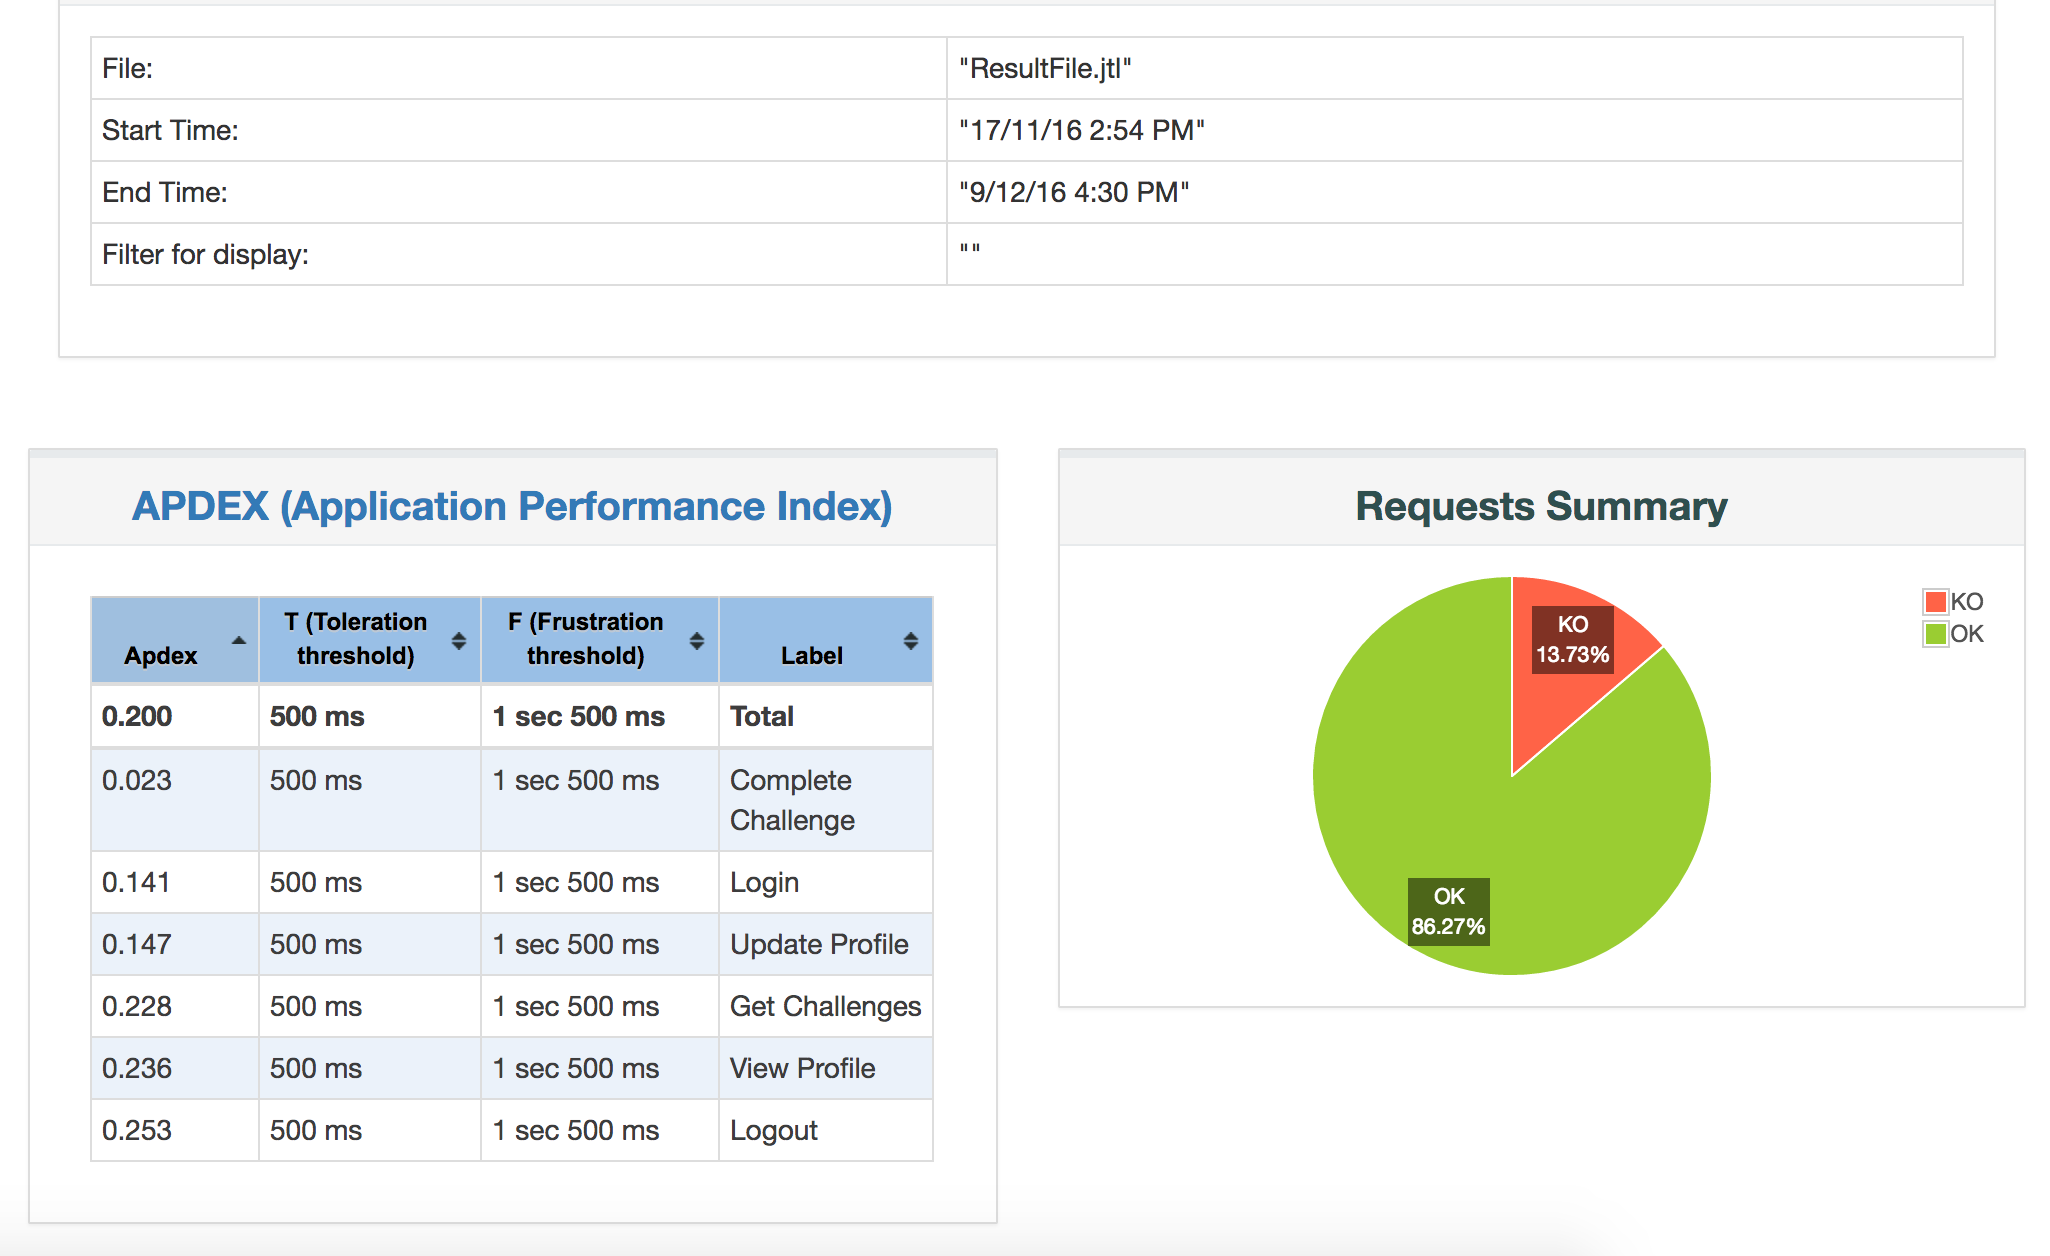
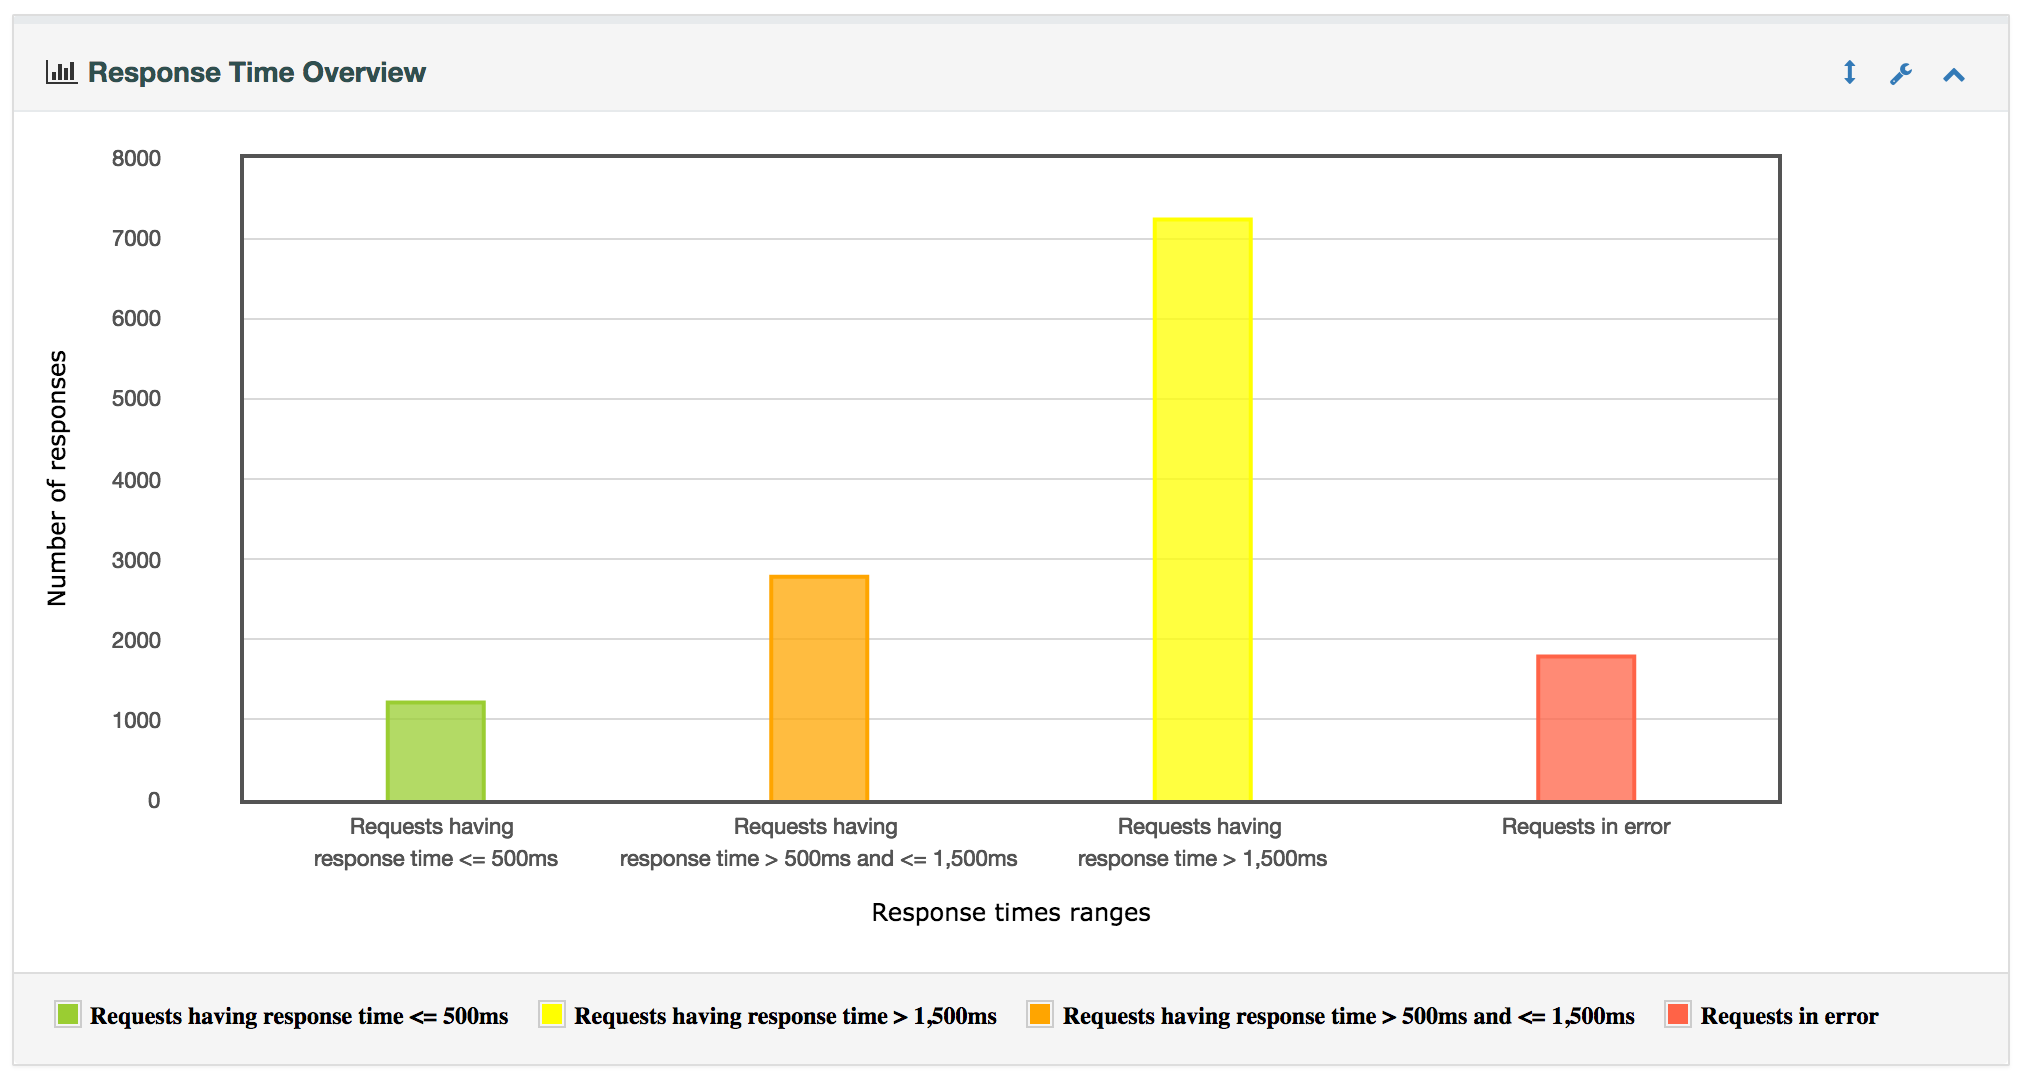
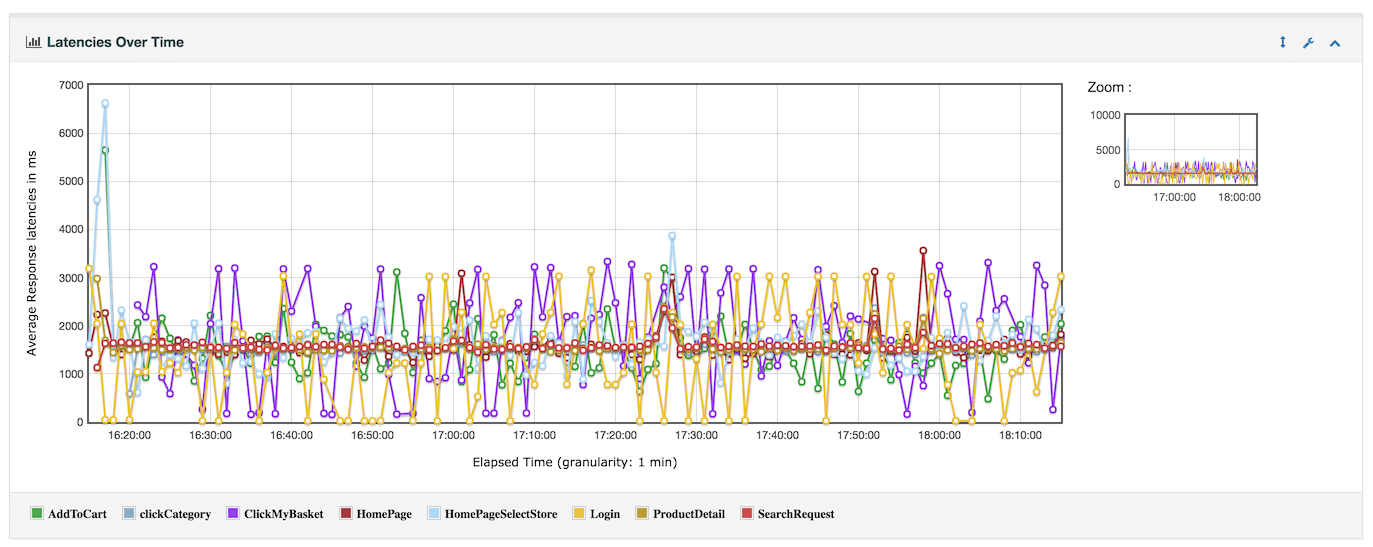
But before that, let’s explore this new feature first of all. The JMeter Report Dashboard is available from JMeter version 3.0 onwards. It basically generates a dashboard of all the performance test reports. While reporting in JMeter is not a new thing, the new dashboard offers some new metrics. And did we say it looks more polished now? Well, we will let you decide on the same. Check out some screenshots below.
Impressed with the new reports already? Sit tight because we will see how we can create them.
Generating JMeter Report Dashboard
- As you might be aware, JMeter saves results in .jtl or .csv format. JMeter uses these files to generate Report Dashboard.
- So if you have .jtl file of any previous test run, you can run below command to generate JMeter Report Dashboard. You might want to navigate to your JMeter’s bin directory before running this command.
1jmeter -g <PATH TO JTL FILE> -o <PATH OF FOLDER WHERE YOU WANT TO SAVE YOUR REPORT> - There is also another way to generate the report. That is to generate report right after your load test completes. But for that, you will have to run JMeter in non GUI mode. You can do this with below command.
1jmeter -n -t <PATH TO JMETER SCRIPT> -l <PATH TO JTL FILE> -e -o <PATH OF FOLDER WHERE YOU WANT TO SAVE YOUR REPORT> - Once you run the above commands, you should see ‘index.html’ file in the specified folder. Just open that file in your favorite browser and voila, you have your graphical report!
- In case you were not able to generate report using above commands, add below lines to user.properties file. This file resides in bin folder of your JMeter’s installation. You will need to restart your JMeter for changes to take effect.
1234567891011jmeter.save.saveservice.bytes=truejmeter.save.saveservice.label=truejmeter.save.saveservice.latency=truejmeter.save.saveservice.response_code=truejmeter.save.saveservice.response_message=truejmeter.save.saveservice.successful=truejmeter.save.saveservice.thread_counts=truejmeter.save.saveservice.thread_name=truejmeter.save.saveservice.time=truejmeter.save.saveservice.timestamp_format=msjmeter.save.saveservice.timestamp_format=yyyy/MM/dd HH:mm:ss
So now that we have our JMeter Report Dashboard, let’s see what it contains.
JMeter Report Dashboard content
While the dashboard shows many details, APDEX certainly stands out the most among them. For the starters, APDEX or Application Performance Index is an open standard by alliance of companies. JMeter provides this index out of the box now. A real good addition, we must say!
Apart from that, the report shows number of passed/failed requests in a nice pie chart. This helps us understand the system health at high level. You can easily conclude whether your performance test is passed/failed by percentage of failures there.
However, the real reporting juice is right after these two metrics. Here you can find performance statistics and error details in a tabular format. The Statistics table basically shows content of Summary Report and Aggregate Report listeners. While the Errors table shows types of errors noticed in performance test along with the percentage of those errors.
And then you have various graphical charts showing different performance metrics. Some notable graphs of interest are Hits per Second, Transactions per Second, Response Time Overview and Latencies Over Time. Some of these graphs are zoomable. You can also configure some charts to show/hide requests. Oh and in case you want to save any chart for later use, you can export it in PNG format.
As you can see, JMeter has come out with really useful feature with its new version. The JMeter Report Dashboard not only shows great reports, it also helps in capturing essential details about performance test. If you are looking for an ideal reporting solution for your JMeter performance test, we encourage you to give JMeter Report Dashboard a try. Oh and while you are at it, don’t forget to share your experience with us in comments!


Great Post. Really helpful for all Jmeter enthusiast out there.
Hi,
I am trying to generate APDEX report but unable to do so.
Getting Error in CMD- An Error occurred: Unknown Arg: ?g Error level=1
Please suggest me the probable solution.